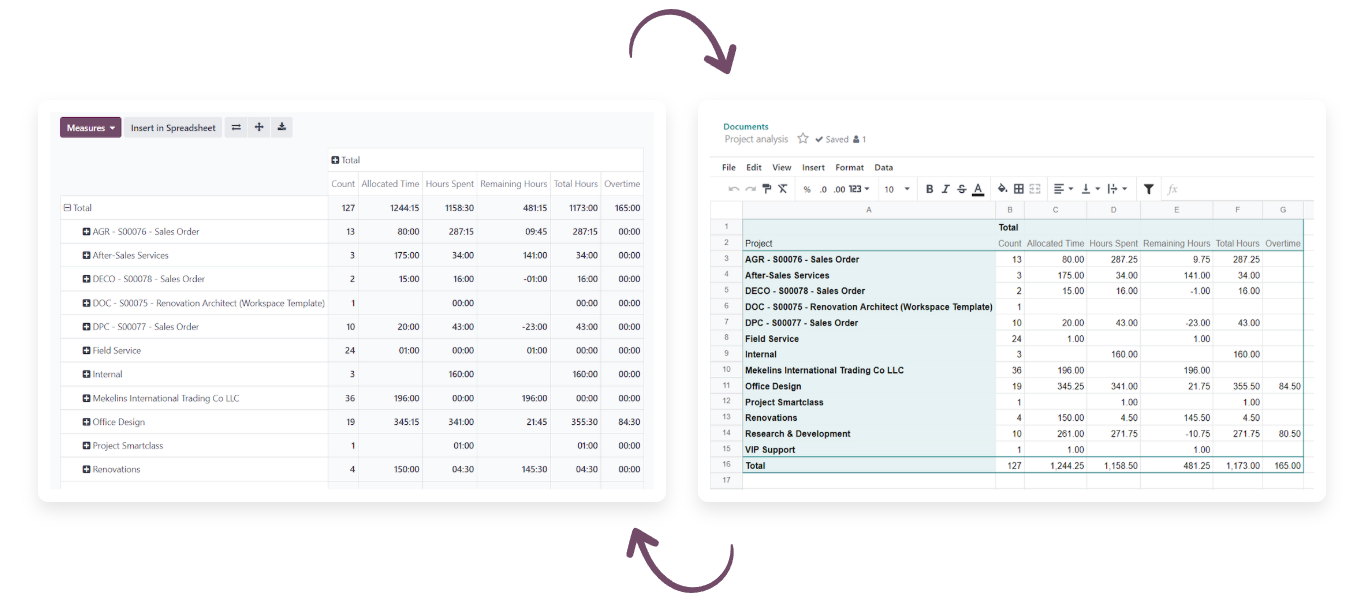
No export-import hassle. Your data is automatically incorporated from your database into charts and spreadsheets, keeping your information up-to-date.
Dynamic reports. Create and view customized reports effortlessly using a user-friendly pivot view with real-time data updates.


One dashboard to access all information. Your data is sorted into customizable categories and translated into visual representations for easy comprehension and informed decision-making.
Collaborate
Share and work simultaneously.
Formulas
Access an easy menu with all the needed formulas.
Charts
Transform your data into visual representations.
Conditional formatting
Effortlessly detect critical issues and identify patterns and trends.
Smart filters
To help you find the needle in the haystack.